.jpeg)
Housing has been at the heart of Sadiq Khan’s campaigns. Its place is so central that Mr. Khan declared the next mayoral election in May a “referendum on rent controls”. When he ran for the mayoral office in 2016, Khan’s vision on housing was rosy: there will be more houses, more affordable homes, first dibs for Londoners… the list goes on. Was it a smokescreen of promises or did he shake up the property market? With three more months to go before the next mayoral election, we visualize some data to see how much he delivered on housing for Londoners.
1. Affordable housing hardly made up one-third of all new buildsAffordable housing was Khan’s first policy priority in 2016. His “ambitious target” was to have “50 per cent of new homes being genuinely affordable”. Of course, reality catches up and the ambition has to be dialed down. Actual statistics revealed that affordable housing completion as a proportion of new builds during Khan’s term is even less than that during Johnson’s. The figure in Johnson’s first three years doubled that of Khan’s. Although more new units are being completed during Khan’s term, which makes the denominator bigger, Johnson’s affordable housing completion in absolute terms is similar if not higher (in total) than Khan’s. Ironically, Johnson hit Khan’s target in 2014-15, when affordable housing completion that year also broke City Hall's record.

2. Construction of new builds still falls short
Mr. Khan did not shy away from criticizing his Tory predecessor, especially on the housing supply crunch during his office. In his 2016 manifesto, Khan wanted more than 50,000 homes built every year to support London’s population growth. The 50K ambition was scaled back by 8K when Khan took office, and the KPI was not new homes but “net additional homes”, which includes new builds, conversions and demolitions. Still, the Mayor did not hit the target in any year during his term.

To Khan’s credit, the supply shortfall was lower than that in Jonhson’s term. However, Khan is no exception to the overpromising politician stereotype, as his mayoralty saw higher targets on housing being pitched only to be missed subsequently.
3. Total affordable housing completions did not increaseHere is where Khan’s lackluster performance on housing is painfully clear. Having proudly raised the target from his predecessor, Khan built only around one half of the 17,000 affordable homes he set out to build.

For someone who ran his platform on housing affordability, a mediocre track record as such cast into great doubts his re-election promises. Although the number of completions inches up every year during his term, only in hindsight does it show that the bar he set was impractical, as he built fewer affordable homes in total than Boris Johnson.
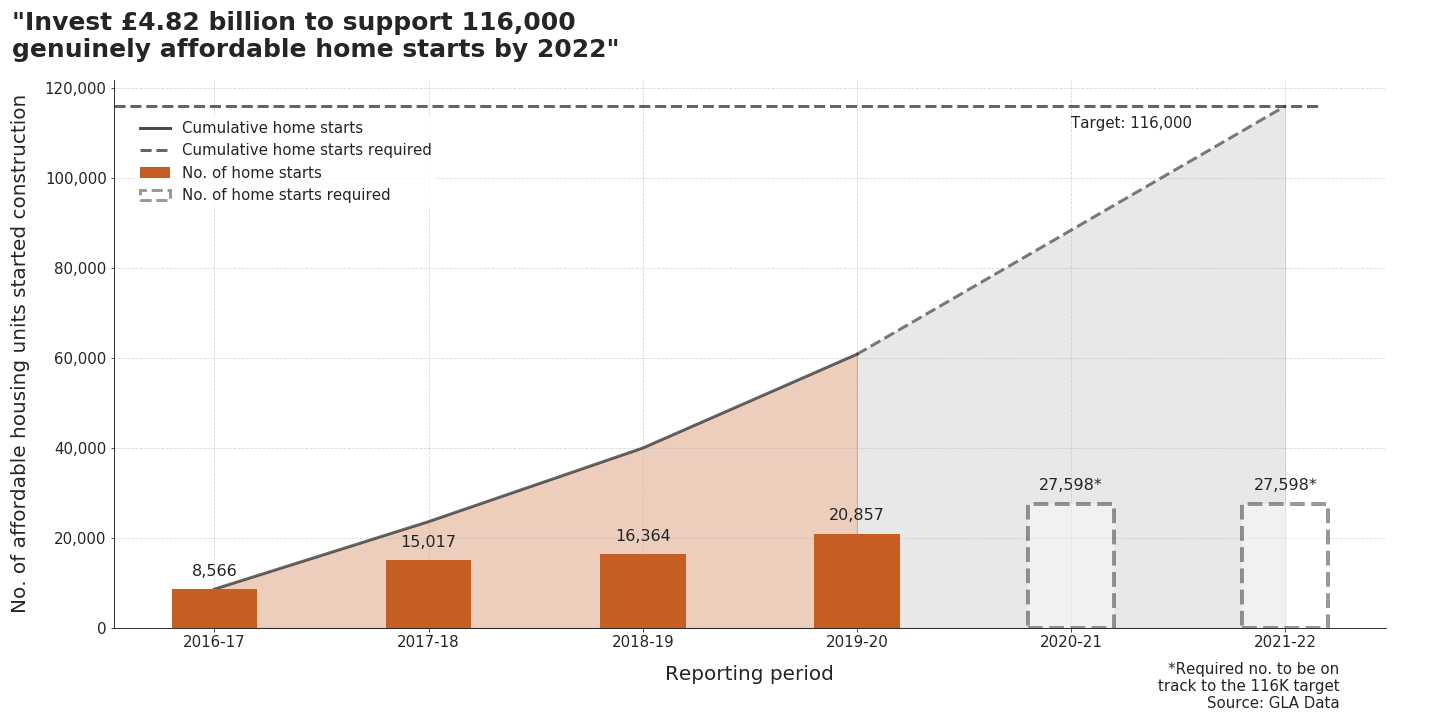
4. The 116K affordable home starts target seems reachableIf completion is not an accurate reflection of the Mayor’s devotion, since projects sometimes take years to materialise, construction starts might provide a good indication of the housing pipeline. In 2018, the Mayor secured 4.82 billion in government funding, with which he pledged to invest in 116,000 affordable home starts by 2022. The yearly affordable home starts are represented by the bars, while the cumulative home starts are shaded in the background. On average, the Greater London Authority has to coordinate 27,598 affordable home starts in 2021-21 and 2021-22, for London to be on track to the 116K target in 2022. These numbers are represented by the grey dotted bars. The required 7K jump from the current 20K level is not impossible, as a similar increase is seen between 2016-17 and 2017-18.
The graph also shows that affordable home starts usually doubled that of completions in a given year during Khan’s term, so a time lag between start and completion is possible. Did Johnson manage to break the affordable home completion record by riding on a backlog of building projects from previous mayors? We could not answer this question as affordable home start data are only available from 2015 onwards.
5. Rent does not seem as unaffordable as Khan claims
While voters contemplate support for rent controls in Khan’s re-election, it is useful to see if rent is indeed as unaffordable as the mayor claimed. Khan outlined in the London Housing Strategy that housing costs, including rent, should not exceed 40% of household income. Based on a schedule of 40 hours per week and 21 working days per month, we estimated the monthly median earnings of a two-person household from the Annual Survey of Hours and Earnings. We then compared that figure to the median monthly rent of a two-bedroom apartment, which is estimated from the median weekly rent statistics provided by the Valuation Office Agency. The reporting periods in the two datasets differ by three months, but those are the best datasets we could get from official sources.
It turns out rent does not make up that much income for a two-person household in London. Most boroughs see a drop in the proportion of income spent on rent. The figure for London is 28.1%, and only residents in one borough (Westminster) pay more than 40% of household income on rent.

The shrinking in the income portion spent on rent seems to be driven by a fast income growth rather than Khan’s policies, as indicated by the green bars below. Khan’s platform in 2016 stressed on providing “genuinely affordable” housing, but his complication of taxology appears unnecessary when rent is more affordable anyways thanks to wage growth.

A caveat for our analysis: the rent/ income ratio might be sensitive to the number of bedrooms and size of household chosen. We are open to debates on methodology, but also suspected that reports which found worsened rent affordability in London might have estimated an individual’s ability to afford a two-bedroom flat, which itself is an unrealistic assumption. Although we computed the median monthly rent by multiplying the median weekly rent by four, our numbers closely resemble the median monthly rent statistics released by the VOA and ONS. We chose to estimate rent that way because 2015 data are not available in the latter dataset.
6. House prices became more unaffordableWhile rent stagnated, house prices increased in most boroughs. Based on a year with 261 working days, we calculated the median income from the same earnings dataset. We then divide the median house price of that year by the median income to obtain the house price to income multiple. This so-called median multiple is often used to measure housing affordability in cities around the world.

In the bubble chart above, bubble colour indicates the multiple's change between 2015 and 2019, while bubble size represents the size of income multiple. Red bubbles represent boroughs that experience an increase in median multiples, and they are mostly boroughs with a lower median house price. This implies that in cheaper boroughs, the income growth is outrun by house price growth. The boroughs with darkest red colour, such as Greenwich and Lewisham, are often regeneration zones, suggesting that renewal projects have helped house prices to catch up. Would rent control, which reduces the profitability of rentals and incentivises landlords to sell their properties, increase the housing supply and arrest the price growth? If China’s case could be of any guidance, it seems low rental returns are more likely to encourage buy-to-leave than a cooler market.
7. More homes are sitting emptyFinally, we looked at the number of vacant houses during Khan’s term. Khan lamented in his 2016 manifesto that properties are often sold off-plan to overseas investors and left empty. His “First-Dibs for Londoners” proposal was received with much fanfare. 4 years later, there was no review of the program’s efficacy, nor did vacant properties decrease. If anything, the number of vacant properties has been climbing up since 2016, although it is still lower than the pre-financial crisis period.

In the 2018 London Housing Strategy Implementation Plan, the Mayor said he would urge councils to increase the Council Tax premium charged on empty homes, but it seems councils only started acting recently.
The Verdict
Did Khan deliver on housing, a policy area so central to his election campaign? Our take is no. The headline targets turned out to be doe-eyed and were almost all missed. His performance in his biggest promises - affordable houses and new builds - was lackluster. We will not deny there is an upward trend in the KPIs he monitors, but is he the shaker he claimed to be in 2016? His humble roots might have struck a chord with voters who relish an underdog story, but he does not prove to be the council estate boy who can fix the Tory housing crisis.
Note: Research for this piece has been tricky as Mr. Khan changed his targets various times and different figures have been reported on similar variables from various authorities. Whenever possible, we used national statistics instead of numbers reported by the GLA, which tended to be more updated but also less reliable.